


Abstract from the American Society of Mass Spectrometry Meeting
(June 8-13, 2003; Montreal, Canada)
Novel Aspect: Stable-isotopic "fingerprinting" of APIs using natural, stable isotopes.
Introduction: Misidentification of pharmaceutical products and their components (APIs and excipients) threatens their safety and efficacy. This affects consumer confidence in these commodities and, in turn, the economic well being of pharmaceutical companies. Characterization of the natural batch-to-batch stable isotopic variation of such materials provides a means to "fingerprint" individual API lots. We explore the use of bulk stable isotopic analyses (BSIA) of API materials as a highly specific means of identification as they are manufactured and compounded into drug products for distribution in the marketplace.
Methods and Instrumentation: We analyzed twenty samples of four APIs from as many as five manufacturers and as many as five individual batches to determine their isotopic provenance. The stable-isotopic composition of this suite of APIs was examined using Isotope Ratio Mass Spectrometry (IRMS; Fig. 1). The purpose was to determine whether IRMS can distinguish between APIs produced by different manufacturers and between different batches of the same API produced by the same manufacturer. In particular, four sample sets were created from ‘pure’ pharmaceutical materials. Each sample set represented a single API and consisted of five identical vials of ostensibly the same material to be isotopically analyzed.
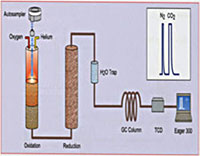
Fig. 1. Schematic drawing of a Finnigan Elemental Analyzer/Mass Spectrometer (EAMS, left) used for N and C and Finnigan Thermal Conversion Elemental Analyzer/Mass Spectrometer (TCEAMS, right) used for H/D and O.
The sample sets were distinguished as follows:
- Set A (Tropicamide) – Five samples, same manufacturer, same lot.
- Set B (Hydrocortisone) – Five samples, same manufacturer, five different lots.
- Set C (Quinine HCl) – Five samples, two manufacturers, two groups of lots.
- Set D (Tryptophan) – Five samples, five different manufacturers.
IRMS Results: Bivariate plots (δD vs. δ18O; δ15N vs. δ13C, etc.) showed a high degree of clustering for Set A and less clustering for Set B. Set C showed tight clustering for each of the two manufacturers, but strong differentiation between the two sub-groups. Set D showed widely separated points for the five different manufacturers in both the bivariate plots.
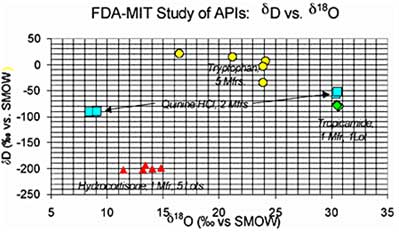
Fig. 2. Bivariate plot of stable isotopic composition (δD vs. δ18O) of the API sample suite mentioned in the text.
Conclusions: For the API samples examined, distinctions were readily made between different manufacturers of the same drug substance. Further, IRMS instrumental precision is sufficiently high to discriminate different lots of a pure active pharmaceutical made by a single manufacturer. More generally, stable isotopic characterization provides highly specific identification of pharmaceutical materials.
Such characterization should be useful in the mitigation of counterfeiting, countertrading, vicarious liability, theft, and patent-protection of synthetic pathways.