


Abstract from the American Society for Mass Spectrometry
(May 27-31, 2001; Chicago, IL, USA)
John P. Jasper1, Francois Fourel2, Andrew Eaton2, John Morrison2 and Andy Phillips2
1 Molecular Isotope Technologies, LLC, 8 Old Oak Lane, Niantic, CT 06357 USA;
2 Micromass UK Limited, Floats Road, Wythenshawe, Manchester M23 9LZ UK
Counterfeiting of pharmaceutical drugs threatens the efficacy of and consumer confidence in these products, as well as the economic well-being of pharmaceutical companies. This paper explores the potential use of bulk isotopic analyses of batch samples of drug products as a highly specific means of identifying such products as they leave the manufacturer and enter the marketplace. Characterization of the ambient (natural) batch-to-batch stable isotopic variation of such products provides a means by which to "fingerprint" individual drug batches.
In this preliminary screening, samples of four commercially-available analgesics were powdered and their 18O/16O, D/H, and 13C ratios measured by continuous flow combustion/pyrolysis isotope ratio mass spectrometry using Micromass’ IsoPrime™ MS. A schematic showing the principle of the Elemental Analyzer-IRMS configuration is shown in Figure 1.
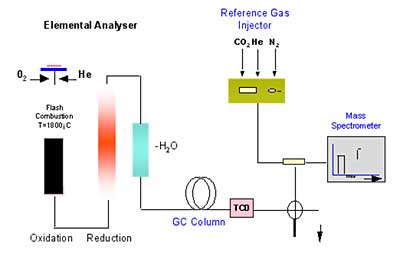
Figure 1. Principle of EA-IRMS in combustion mode
The samples analyzed consisted of two different types of Acetaminophen and two types of Aspirin. Each data point corresponds to a different lot number. The intra-batch reproducibilities of these techniques are 0.3‰ for 18O, 0.2‰ for 13C, and 2‰ for D/H. The inter-batch isotopic homogeneity is within the following figures. While these analgesic batch samples are accepted to be chemically homogeneous because they are manufactured according to precise protocols, the present results show that they are isotopically heterogeneous for reasons discussed below. Oxygen isotopic variations span from 5.1 to 24.3 ‰ vs VSMOW (δmax = 19.2 ‰). Hydrogen isotopic vari-ations span from —73.1 to —48.8 ‰ vs. VSMOW (δmax = 24.3 ‰). Carbon isotopic variations span from —47.0 to —27.0 ‰ vs. VSMOW (δmax = 20.0 ‰). An example of the isotopic range for the different products is given relative to 18O data. Similar ranges are observed for 13C and D/H.
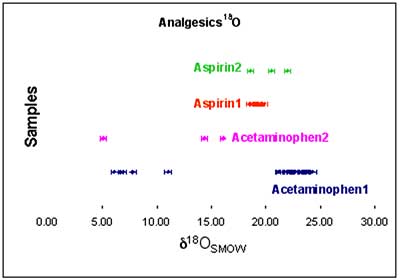
Figure 2. δ18O data range for analgesic drugs.
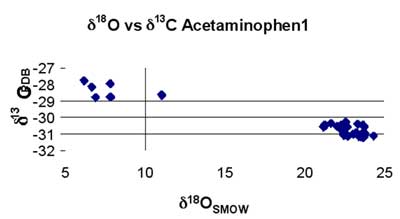
Figure 3. Combination of δ13C and δ18O data for type 1 samples.
Plausible explanations for the observed δ18O variations observed include: (i) natural isotopic variation in the raw starting materials, (ii) the contribution of the inactive ingredients (excipients), and (iii) isotopic fractionation during the synthetic processing of the active pharmaceutical ingredients in the drugs. Beyond individual isotopic plots (e.g. Fig. 2), the power of this isotopic product authenticity technique multiplies when combining data from the measurement of a number of different isotopes from the same sample.
While property-property plots are a basic form of analysis, more sophisticated approaches like principle component analyses have already been successfully applied in multi-isotopic approaches to product authentication. However, those methods require more data points and constraints than in the present cases to be significant.
We have shown here that although specific drug products may be manufactured according to precise protocols for chemical composition, they remain significantly isotopically heterogeneous from batch to batch. These preliminary data indicate the possibility to employ these isotopic differences in a multi-isotopic approach for product identification. Such isotopic product authentication may plausibly become a powerful tool for patent protection as well as safety controls in drug manufacturing and distribution.